There is energy in the air all around us. Some of it exists in the form of thermal energy that one can sense—heat in air that impacts one's perception of thermal comfort. But there is also an energy embodied in the vapor present in the air. While this "hidden" heat is not experienced as warmth, it certainly has a bearing on thermal comfort as well.
In order to distinguish between these two types of heat in the air, one must determine the air's enthalpy.
Enthalpy
Enthalpy is a term used to describe the total amount of heat present in an air-vapor mix. It is the sum of both the sensible and latent heat present in the air. Recall that sensible heat is the “dry” heat in the air related to dry-bulb temperature (think glowing coils on an electric cooking range); while latent heat is the "wet" heat release into the air as water phase-changes to vapor (think vapor released to the air as a tea kettle's contents boil atop said cooking range). (See Thermal Dynamics: Visualizing Sensible Versus Latent Heat for more information on sensible vs latent heat.)
The units for sensible heat, latent heat and enthalpy are all the same: BTUs per pound of dry air (BTU/lb).
Plotting Dry-Bulb and Wet-Bulb Temperatures
In order to ascertain how much sensible versus latent heat is present in air-vapor mix, both the dry-bulb and wet-bulb temperatures must be defined and plotted on the psychrometric chart.
If the air in a room were completely dry, its thermal properties could be defined using a conventional thermometer to measure its dry-bulb temperature. On the other hand, if a thermometer with a wetted bulb moved rapidly through the air, evaporation would be induced to some degree. If the air is relatively dry, evaporation is rapid, resulting in a cooling of the bulb. This would result in a measured temperature substantially lower than the dry-bulb temperature. If the air is saturated, the dry-bulb and wet-bulb temperature readings may be similar—perhaps virtually identical. The difference between the dry-bulb and wet-bulb temperature in a given air-vapor mix is known as the wet-bulb depression. (See Thermal Dynamics: Visualizing Sensible Versus Latent Heat for more information on dry-bulb temperature and wet-bulb temperature.)
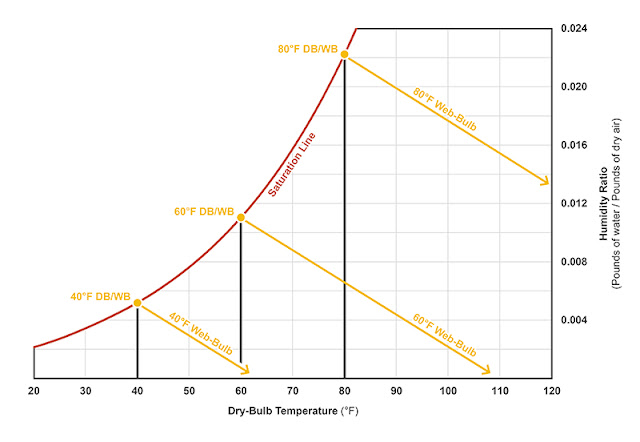
The wet-bulb depression at various conditions can be plotted on the psychrometric chart (see Figure 1). Equipped with both a dry-bulb and wet-bulb temperature reading, one can determine precisely where the air-vapor mix lands on chart.
|
Figure 1: At 100 percent saturation, the wet-bulb (WB) temperature equals the dry-bulb (DB) temperature. In order to maintain a constant WB temperature, the humidity ratio must be lowered as the DB temperature increases. Notice the WB lines run parallel with each other. Illustration courtesy of author. |
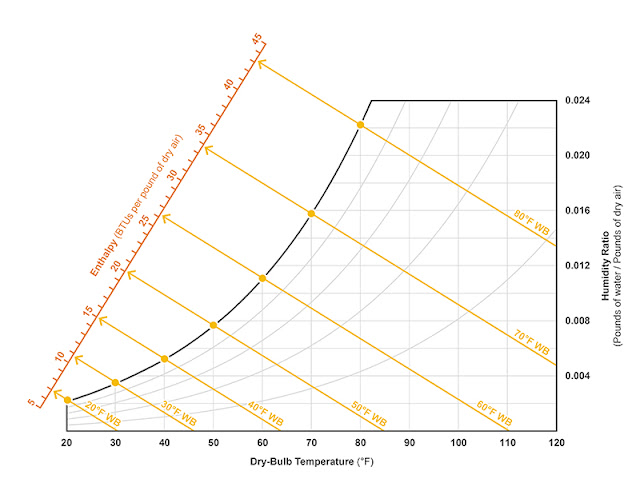
The web-bulb temperature lines maintain a constant enthalpy—meaning as condensation or evaporation occurs, there will be a proportionate give-and-take of sensible and latent heat and the total BTUs per pound of dry air will remain the same. The enthalpy can actually be scaled across the psychrometric chart (see Figure 2).
|
Figure 2: Enthalpy lines (which run parallel with wet-bulb temperature lines) provided to a scale overlaid on the psychrometric chart. Illustration courtesy of author. |
The dry-bulb and wet-bulb temperature of any air-vapor mix can be easily determined using a sling psychrometer. Armed with such data, one can easily ascertain the humidity ratio, relative humidity and enthalpy of any air-vapor mix—all of which provides critical information to assess thermal comfort and environmental quality.


